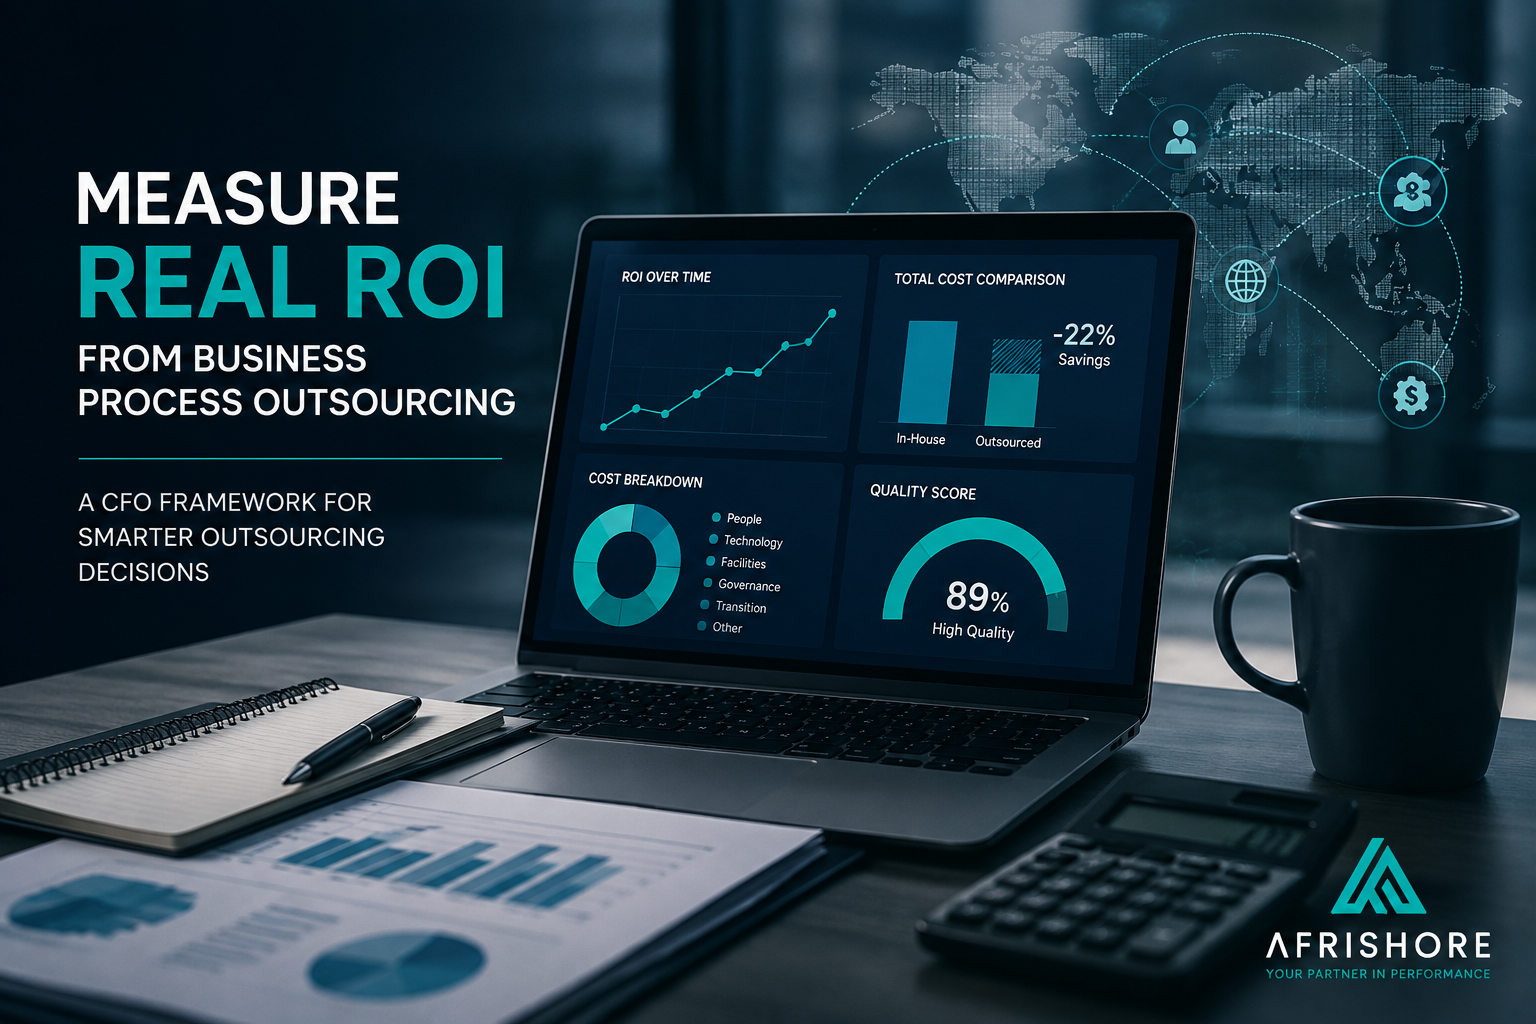
A widely cited Gartner analysis covered by ZDNet found that around half of outsourcing projects fail to deliver on expectations – not because outsourcing doesn’t work, but because most business cases are built on a headline hourly rate instead of a full total-cost-of-ownership comparison. ISG’s 2024 Market Lens BPO Study, surveying 368 global BPO decision-makers, found the realistic number is an average 15% cost reduction alongside an 11% improvement in quality – a far cry from the 60–75% figures that show up in vendor pitch decks. This is the measurement framework that closes that gap: how to build a BPO business case that survives scrutiny, and how to know honestly whether a program already running actually paid off.

Quick Answer Measuring real BPO ROI means comparing total cost of ownership – not headline hourly rate – against in-house cost, including governance, transition, and quality-risk line items. Realistic net savings run 15–30% (ISG, 2024), with operational break-even typically within 90–120 days and full ROI by months 6–9.
Key Takeaways
- ISG’s 2024 Market Lens BPO Study (368 global decision-makers) found an average 15% cost reduction from BPO programs versus in-house operations, alongside an 11% improvement in quality performance – the realistic planning number, not the 60–75% figures seen in individual case studies
- Everest Group’s 2024 CFO survey (200 CFOs) found an average 15% ROI on finance and accounting outsourcing overall, with top-performing functions like management reporting (43%) and accounts receivable (40%) delivering far higher returns
- A widely cited Gartner analysis found roughly half of outsourcing projects fail to meet expectations, primarily due to weak upfront planning and governance – not vendor failure
- A detailed cost build-up for a 10-seat offshore program shows a headline vendor invoice can expand by 80%+ once governance, transition, attrition, and rework costs are added – the gap between advertised savings and net savings
- Well-run BPO programs typically reach operational break-even within 90–120 days, with full, sustainable ROI materializing between months 6 and 9 as workflows mature past the initial ramp period
- Everest Group’s indexed operating-cost analysis shows destination choice changes fully loaded BPO FTE cost by more than 200% across regions, but the lowest hourly rate isn’t always the best net ROI once quality-adjusted costs – rework, escalations, attrition – are priced in
Why Do Most BPO Business Cases Fail to Survive Scrutiny?
Roughly half of outsourcing projects fail to deliver on expectations, and the root cause is consistently the same: a business case built on a headline rate comparison instead of a full cost-of-ownership model.
The failure rate cited across industry commentary is sobering but instructive: a widely referenced Gartner analysis concluded that around half of outsourcing projects fail to live up to expectations, attributing this mainly to weaknesses in upfront planning and governance rather than the fundamental economics of outsourcing itself. A parallel 2025 automation-ROI study found 31% of organizations saw no measurable cost improvement from process automation investments despite spending, citing poor process selection, weak change management, and integration complexity as the primary causes – the same structural failure modes that show up in underperforming BPO programs.
The pattern in both cases is the same: the initiative wasn’t wrong, the measurement and planning around it was. A credible ROI framework exists specifically to prevent that outcome – by forcing the comparison to include transition costs, governance overhead, and quality risk from day one, rather than discovering them after the contract is signed.
What’s a Realistic BPO Savings Number – 15–30%, or 60–75%?
Individual case studies advertising 60–75% cost reduction are real, but they’re the upper bound achieved with strong vendor selection and tight governance – not the planning assumption a CFO should build a business case around.
Cross-industry research is more consistent on realistic savings than the marketing materials suggest. ISG’s 2024 Market Lens BPO Study found an average 15% cost reduction across surveyed programs. Everest Group’s 2024 CFO survey of 200 finance leaders found an average 15% ROI on finance and accounting outsourcing overall – though specific functions performed considerably better, with management reporting delivering 43% ROI, billing 41%, accounts receivable 40%, and capital budgeting 39%.
Realistic Cost-Savings Ranges by Function
| Function | Realistic Net Savings | Notes |
| Customer support / contact center | 40–60% | Gross savings vs. US/UK in-house, offshore/nearshore models |
| Back-office / admin / data entry | 25–45% | Standardized, repeatable processes |
| Finance and accounting | 30–50% | Specialized providers, F&A-specific functions |
| HR and payroll | ~27% | Reduced recruiting and onboarding overhead |
| Overall program average (ISG, 2024) | ~15% | The realistic planning baseline, not the ceiling |
The individual case studies that report 50–75% reductions are real – but they represent well-executed programs with disciplined vendor selection, not the default outcome. The honest planning range for a first-year business case is 15–30% net savings, with upside from there as the program matures and processes are optimized.
What’s a Realistic Timeline to See ROI From a BPO Program?
Well-run BPO programs reach operational break-even within 90–120 days, with full, sustainable ROI typically materializing between months 6 and 9 as workflows mature past the initial ramp period.
This is one of the most searched questions from buyers evaluating a BPO decision, and the data gives a consistent answer. Analysis of offshore program timelines finds operational break-even typically achieved within 90–120 days, with full, sustainable ROI – reflecting the total cost-of-ownership reduction once workflows have matured past initial ramp – reached between months 6 and 9. Closely related business process automation research reports payback periods of 3–18 months depending on process complexity, with well-scoped initiatives often achieving payback in under 6 months.
The practical guidance for a business case: treat break-even as a quarter-end milestone and full ROI as a two-quarter milestone, provided the transition is disciplined and ramp assumptions are realistic rather than optimistic. Programs that promise faster-than-90-day full ROI are usually underestimating ramp time, not outperforming the market.
What Does the Full BPO ROI Equation Actually Include?
A credible ROI model treats BPO as a total-cost-of-ownership comparison, not a wage arbitrage calculation – hard savings, soft operational benefits, and revenue effects all belong in the equation.
Hard savings start with the fully loaded labor cost delta. US customer support roles often cost $53,000–80,000 fully loaded once salary, benefits, payroll taxes, and overhead are included; offshore BPO seats for comparable roles typically price at $8–20 per hour, producing labor cost differentials of 40–80% depending on destination and function. A practical CFO-grade method, outlined by Dot-code: calculate the “real in-house cost” as salary × 1.3 (to account for benefits) plus overhead plus annualized recruiting cost, then compare that figure against the vendor quote plus a 15–20% management overhead adjustment – that adjusted comparison, not the raw hourly rate, is the real savings number.
Soft benefits are quantifiable, not hand-wavy, when tracked properly. ISG’s study found an 11% average quality-performance improvement for outsourced operations versus in-house. Executive research consistently shows leaders citing access to hard-to-source expertise and the ability to refocus internal teams on core priorities as motivations on par with cost savings – both of which have measurable downstream financial effects even though they sit outside a simple labor-savings line item.
Revenue-side ROI requires different treatment for functions like SDR/lead generation and collections, where the outsourced function drives revenue rather than reducing cost. Everest’s CFO survey found the highest F&A ROI in functions directly affecting cash collection and revenue realization – accounts receivable and billing reported ROI of 39–41%. For outsourced SDR or lead generation, the correct ROI formula is incremental gross margin from closed deals divided by fully loaded program cost, including fees, tools, and management time – not a cost-reduction calculation at all.
What Hidden Costs Erode Advertised BPO Savings?
A detailed cost build-up for a real offshore program shows the headline vendor invoice can expand by 80%+ once governance, transition, attrition, and rework are added as explicit line items.
This is where most business cases quietly fall apart. A detailed cost analysis of a 10-seat offshore program found the headline vendor invoice – roughly £190,000 – expanded to a true year-one cost closer to £350,000 once retained governance and QA (about £55,000/year for roughly one FTE), one-off transition and knowledge-transfer costs (£35,000), compliance and international data-transfer costs (£15,000), attrition and ramp drag (£40,000), and tooling and secure-access costs (£15,000) were added as explicit line items. The same analysis puts all-in transition-plus-productivity-drag costs at $10,000–25,000 per offshore hire, with implementation budgets running 30–45% over initial plan in many programs.
Transition and ramp costs deserve their own line item rather than being absorbed into “miscellaneous.” Most transitions take one to six months depending on process complexity, regulation, and technology integration. Compressing knowledge transfer is consistently identified as the number-one cause of ramp-quality problems – practitioner guidance recommends 3–4 weeks of dedicated knowledge transfer, 2–4 weeks of parallel running, and realistic expectations that new agents operate at only 60–70% throughput for the first 4–8 weeks.
Governance overhead is frequently invisible in vendor sales materials but real in practice – typically 10–30% of the vendor invoice, or 5–15% of annual contract value, depending on program complexity and regulatory sensitivity. Outsourcing governance research consistently recommends treating this as a funded function with explicit roles and cadence, not an assumed zero-cost activity absorbed by existing staff.
Quality-cost risk is the least-tracked but potentially most damaging erosion factor. Poorly governed offshore programs can see 5–12% rework rates – tickets repeated, documentation redone, work chased twice – each instance directly adding cost and customer frustration. First-year agent attrition in under-managed offshore hubs can run 40–60% against 15–25% for comparable onshore teams, with each departure triggering 6–10 weeks of ramp on the replacement and elevated SLA-breach risk during that window. This is precisely why “cheapest seat” vendor selection frequently delivers worse total ROI than a mid-priced, higher-quality provider – the rate advantage disappears into rework and re-hiring costs that never show up in the original business case.
How Do You Build a Defensible ROI Measurement Framework?
A defensible ROI case rests on three things: a locked pre-transition baseline, a consistent KPI set tracked post-transition, and a modeling approach that goes beyond a single-year savings percentage.
Core KPI set. A credible outsourcing scorecard tracks cost and efficiency (cost per contact or transaction, cost per FTE or productive hour, handle time or cycle time), quality and CX (CSAT, NPS, first-contact resolution rate, error and rework percentage), productivity (contacts per FTE per hour, backlog and queue levels), workforce health (attrition and absenteeism), and contract performance (SLA adherence, compliance incidents). Everest Group’s outcome-based metrics research confirms these are the metrics that show up consistently as the actual working scorecard, not a theoretical wish list.
Baseline-setting. The single most common reason a post-transition ROI claim can’t survive scrutiny is that no honest pre-transition baseline was locked. Best practice is capturing at least 3–6 months of in-house data before transition: fully loaded cost per FTE (salary, benefits, payroll taxes, overhead, and recruiting), cost per contact or transaction by function, and the full operational baseline (AHT, CSAT/NPS, FCR, error rates, backlog, SLA adherence, attrition). Without that baseline, any claimed improvement or degradation after the transition is unattributable – you’re comparing to a guess, not a number.
Modeling the decision. A CFO-grade model layers three views. First, the annual net savings view: net savings equals in-house total cost of ownership minus (vendor invoice plus governance plus amortized transition cost plus residual overhead), expressed as a percentage reduction and checked against the 15–30% industry benchmark as external validation. Second, payback period: initial transition and setup cost divided by monthly net savings, benchmarked against the 90–120 day break-even / 6–9 month full-ROI pattern described above. Third, a multi-year total-cost-of-ownership view across 3–5 years – transition costs as a negative in year zero, net annual savings as positive cash flows in years one through three, adjusted for wage inflation, FX, and attrition. Layering scenario analysis on top – sensitivity cases for attrition, rework rate, FX movement, and volume changes – turns “15–40% savings” from a single confident number into a realistic distribution a board can actually defend. This same segmentation discipline is what makes the onshore-offshore hybrid model deliver on its promised economics rather than a fully offshore build.
How Does Destination Choice Change the ROI Math?
Fully loaded BPO FTE cost varies by more than 200% across regions, but the cheapest destination isn’t automatically the best net ROI once rework, escalation, and attrition costs are priced in.
Everest Group’s indexed annual BPO operating cost analysis confirms that annual operating cost per FTE varies by more than 200% across cities and regions – destination is one of the largest single levers in the ROI equation, but it isn’t the only one. A separate executive analysis places South Africa’s BPO sector FTE cost at $30,000–50,000 per year – roughly 11% below the global average, and 50–70% below equivalent US/UK roles.
The quality-adjusted view is where destination selection gets more interesting than a pure rate comparison. Industry commentary on customer experience benchmarks reports South African delivery scoring meaningfully higher on CX quality than some lower-cost alternatives, citing accent neutrality, cultural alignment with Western markets, and time-zone overlap as the drivers – factors that reduce rework and escalation costs specifically for UK- and Europe-facing workflows. The practical logic: lower-rate destinations can deliver maximum labor arbitrage on paper, but without careful management they can incur meaningfully higher rework, escalation, and cultural-friction costs that erode net ROI. Mid-rate, higher-quality destinations may charge a modestly higher per-FTE rate but achieve better CSAT, fewer errors, and lower attrition – frequently delivering greater net ROI over a 3–5 year horizon once those quality costs are priced into the model rather than ignored. Pricing baselines for the destination comparison itself are covered in Afrishore’s call center outsourcing cost guide and outsourced customer support cost breakdown.
Frequently Asked Questions
What’s a realistic timeline to see ROI from a BPO program?
Well-run programs typically reach operational break-even within 90–120 days, with full, sustainable ROI materializing between months 6 and 9 as workflows mature past the initial ramp period. Programs promising faster full ROI are usually underestimating transition and ramp time rather than outperforming the norm.
What percentage cost savings should I expect from outsourcing?
Cross-industry research puts realistic net savings at 15–30% – ISG’s 2024 study found an average 15% cost reduction across 368 surveyed programs. Individual case studies advertising 50–75% savings are real but represent the upper bound achieved through strong vendor selection and tight governance, not the default outcome.
How do I compare ROI across BPO outsourcing partners?
Build the comparison on total cost of ownership, not headline hourly rate: calculate fully loaded in-house cost (salary × 1.3 for benefits, plus overhead and recruiting), then compare against each vendor’s quote plus a 15–20% management overhead adjustment, governance cost, and amortized transition cost. Layer in quality metrics – CSAT, rework rate, attrition – since the lowest rate isn’t always the best net ROI.
What hidden costs most commonly erode BPO savings?
Governance and vendor management overhead (typically 10–30% of the vendor invoice), one-off transition and knowledge-transfer costs, attrition and ramp drag when replacement agents need 6–10 weeks to reach full productivity, and rework from poorly governed programs (5–12% of volume in under-managed engagements) are the most commonly underestimated costs in a BPO business case.
Why do around half of outsourcing projects fail to meet expectations?
A widely cited Gartner analysis attributes this primarily to weaknesses in upfront planning and governance, not to outsourcing as a model failing. Common root causes include compressed knowledge transfer, under-scoped parallel running periods, unrealistic productivity assumptions during ramp, and vendor mismatch – all of which a proper measurement framework is designed to surface before they become expensive surprises.
Does destination choice affect ROI, not just cost?
Yes. Fully loaded BPO FTE cost varies by more than 200% across regions, but quality-adjusted ROI often favors mid-rate, higher-quality destinations over the absolute lowest hourly rate, since rework, escalation, and attrition costs from lower-quality delivery can erode more value than the rate difference saves.
How do I know if my existing BPO program is underperforming?
Compare current KPIs – cost per contact, CSAT, rework rate, attrition, SLA adherence – against your locked pre-transition baseline, not against the vendor’s original pitch. A program that’s drifted more than a few points off its committed SLAs, or where rework and attrition have crept above 10–15%, is a program worth re-scoping or re-tendering before the next renewal.
Conclusion
The gap between advertised BPO savings and realized BPO savings is almost always a measurement problem, not an execution problem. Programs that lock an honest pre-transition baseline, budget governance and transition costs as explicit line items rather than absorbing them silently, and track a consistent KPI set from day one are the ones that can actually defend their ROI claim eighteen months later – and the ones that catch underperformance early enough to fix it rather than discover it at contract renewal.
To build or stress-test the business case for outsourcing a non-core function, contact Afrishore BPO for a no-obligation assessment. Afrishore operates from Johannesburg and Cape Town, with over 20 years of BPO delivery experience, and holds ISO 27001, ISO 9001, HIPAA, and PCI-DSS certifications.
Related reading: Business Process Outsourcing · The Onshore-Offshore Hybrid Team Model · BPO vs. In-House Teams · South Africa vs. Philippines · Call Center Outsourcing Cost · Offshore Administrative Services